We have added the ability to track metrics, such as your Amazon product rank, Google search rank, YouTube likes and comments, and more. Blitapp can show you the metrics in your history, and the new page shows the trends over time.
Today, we offer the following trackers:
- Amazon: Category rank, Search rank. See more details in our new Support portal
- Google: search rank. More Information is available in the support page.
- Twitter: Likes, Quote Tweets, and Retweets. See how they work here.
- YouTube: Comments, Likes, and Views. Check out some examples on our support page.
We will add more trackers as we get requests from our users. We also support private and custom trackers that can be added on demand.
You can now get your screenshots uploaded directly to your cloud storage through Apps, including your own Microsoft OneDrive account.
Add one or multiple trackers to your capture
You will find a new option under the list of URLs: select one or multiple trackers to add.
For example, here are two trackers that check the rank of two websites (blitapp.com and browshot.com) for three Google searches:
![]()
You can add automation steps to check multiple Google results pages:

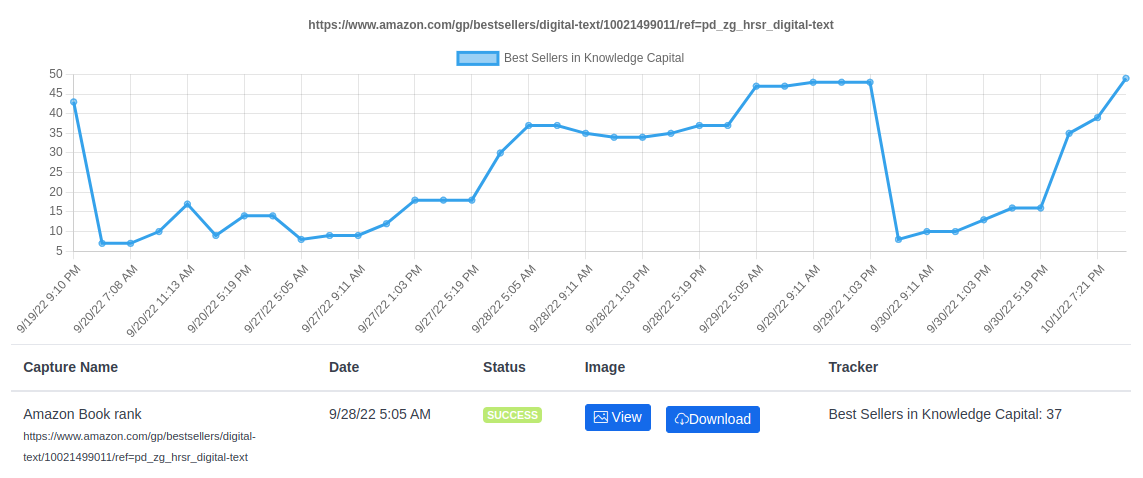
For Amazon, you can check the rank of one or multiple products in Amazon categories or any Amazons search:

We can add trackers for prices, status, etc.
See the metrics in your history
When found, the metrics are reported in your history:

You can track multiple metrics for multiple URLs in one capture. Blitapp will automatically retrieve and show the relevant information. In this example, Blitapp retrieved the video’s name and the metric type (Comments, Likes, and Views).
Visualize the trends
There is a new tab in the history to visualize the metrics as graphs.
![]()
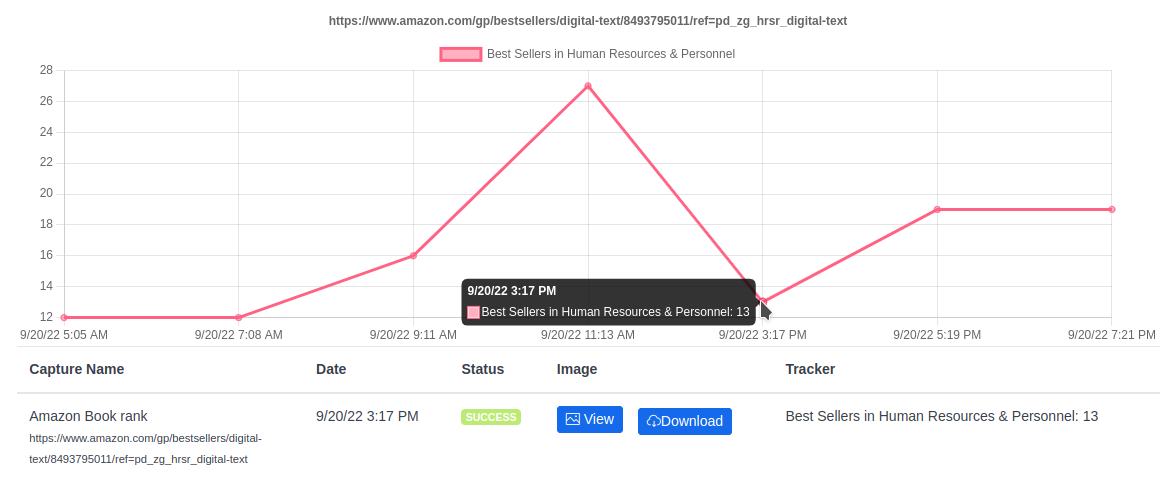
You can see all your trackers for the last 30 days by capture. Select one, and you can see a graph of the different metrics:
![]()
Click on any data point to get the corresponding screenshot:

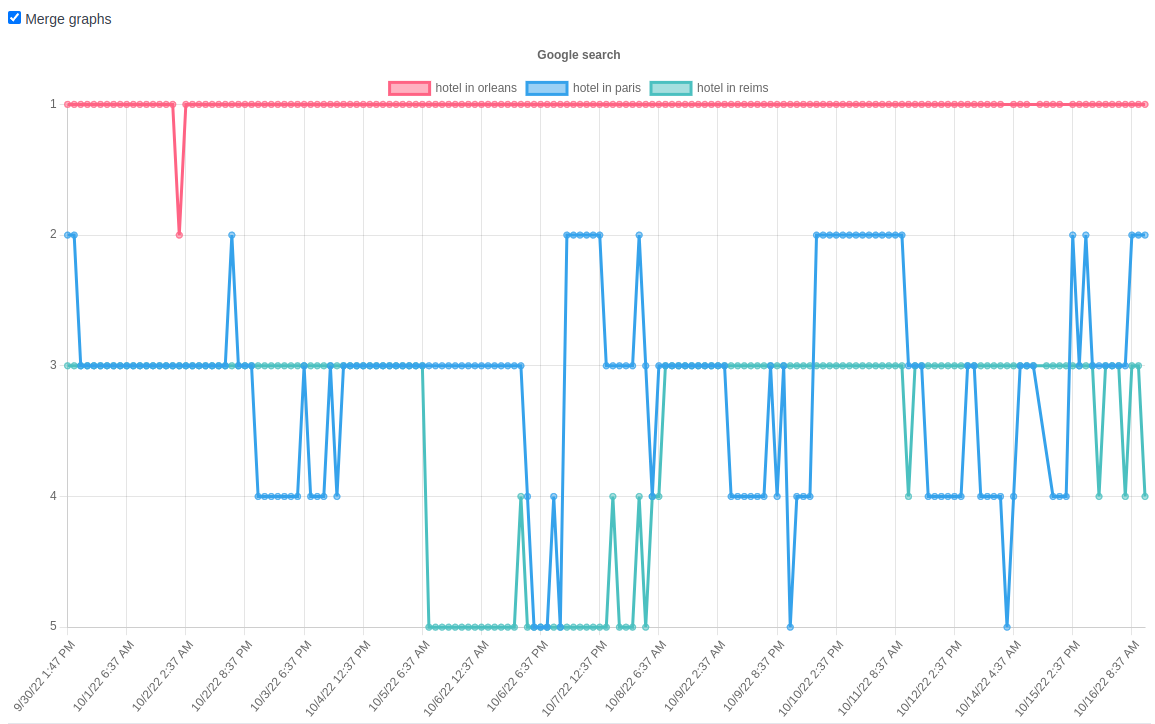
You can merge the multiple graphs to compare them. For example, you can compare the rank of a website for various searches:

Trackers and screenshots as proof
For each metric, you have a proof in the form of a screenshot. We also offer custom apps, for example, to produce a dashboard that can be shared within a company or with your customers.
Trackers are in Beta
This feature is still in beta. Please report any bugs or improvements you’d like to see. Eventually, we will add several trackers as part of each plan.